Illustrative example
80 Before→100 After
What is the percentage increase?
Elements Numerical
Interpret tables and charts. Each question has its own time allowance.
View guidanceThe Elements adaptive ability tests, Aspects screening, the KF4D and leadership potential assessments and viaEdge. How the per-question adaptive timing works, which employers set which, and how the percentile is read against the role.
Free · No sign-up · Scored the moment you finish
Elements is Korn Ferry’s graduate and professional ability range, sat under the Talent Q name as often as the Korn Ferry one: Talent Q went to Hay Group in 2014 and came to Korn Ferry with it in 2015. Elements Numerical is reported as 12 questions grouped in threes on one data exhibit, and this test follows that structure, its business data item style and its difficulty, over the 16 minutes the real test’s per question limits add up to. Korn Ferry score a question you run out of time on exactly as though you had answered it wrongly, which is why the real clock bites harder than the one here.
You have 16 minutes to answer 12 questions. The questions come in four sets of three, each set built on one exhibit of business data. A calculator and rough paper are expected. Some of the data in each exhibit is not needed by any question, and choosing the right figures is part of the test. The real test clocks each question separately, giving you 90 seconds for the first question on a data set and 75 seconds for each one after it, and moving on by itself when that time is up. This practice test gives you the same total time as a single clock, so you can spend it across the questions however you like. The difficulty does not build gently: the real test is adaptive and is designed to keep you near your limit throughout.
Question 1 of 12
Assets (financial year end)
| A | B | C | D | E | |
|---|---|---|---|---|---|
| Liquid assets | 198,050 | 145,050 | 178,500 | 158,425 | 195,999 |
| Loans made | 85,425 | 98,050 | 51,050 | 99,050 | 62,500 |
| Derivatives | 65,345 | 98,485 | 92,465 | 89,100 | 88,740 |
| Fixed assets | 75,050 | 92,050 | 71,500 | 108,425 | 90,999 |
| Total | 423,870 | 433,635 | 393,515 | 455,000 | 438,238 |
Liabilities (financial year end)
| A | B | C | D | E | |
|---|---|---|---|---|---|
| Reserve liabilities | 78,425 | 89,050 | 95,425 | 88,999 | 71,430 |
| Borrowings | 98,050 | 95,500 | 85,050 | 98,425 | 98,500 |
| Share liabilities | 65,425 | 60,425 | 70,430 | 76,335 | 90,999 |
| Other liabilities | 181,500 | 155,999 | 179,425 | 151,425 | 192,500 |
| Total | 423,400 | 400,974 | 430,330 | 415,184 | 453,429 |
The tables show the assets and the liabilities of five competitor firms at the financial year end, in pounds. Firm E’s fixed assets are what percentage of firm E’s total assets?
Answer: B. 20.8%
Read firm E’s fixed assets from the assets table: 90,999. Read firm E’s total assets from the same column: 438,238. Divide and convert to a percentage: 90,999 ÷ 438,238 = 0.20765, so 20.8%. The most tempting wrong method is to divide by the total at the foot of the liabilities column, 453,429, which gives 20.1%. That base settles a different question: it measures fixed assets against what the firm owes, not against what it owns. The loans made, borrowings and other liabilities rows are not needed here.
Question 2 of 12
Assets (financial year end)
| A | B | C | D | E | |
|---|---|---|---|---|---|
| Liquid assets | 198,050 | 145,050 | 178,500 | 158,425 | 195,999 |
| Loans made | 85,425 | 98,050 | 51,050 | 99,050 | 62,500 |
| Derivatives | 65,345 | 98,485 | 92,465 | 89,100 | 88,740 |
| Fixed assets | 75,050 | 92,050 | 71,500 | 108,425 | 90,999 |
| Total | 423,870 | 433,635 | 393,515 | 455,000 | 438,238 |
Liabilities (financial year end)
| A | B | C | D | E | |
|---|---|---|---|---|---|
| Reserve liabilities | 78,425 | 89,050 | 95,425 | 88,999 | 71,430 |
| Borrowings | 98,050 | 95,500 | 85,050 | 98,425 | 98,500 |
| Share liabilities | 65,425 | 60,425 | 70,430 | 76,335 | 90,999 |
| Other liabilities | 181,500 | 155,999 | 179,425 | 151,425 | 192,500 |
| Total | 423,400 | 400,974 | 430,330 | 415,184 | 453,429 |
The tables show the assets and the liabilities of five competitor firms at the financial year end, in pounds. Firm A’s liquid assets are what percentage of the combined liquid assets of all five firms?
Answer: D. 22.6%
Add the liquid assets row across all five firms: 198,050 + 145,050 + 178,500 + 158,425 + 195,999 = 876,024. Firm A’s share of that is 198,050 ÷ 876,024 = 0.22608, so 22.6%. The most tempting wrong method is to widen the base by adding the fixed assets row into it, giving 198,050 ÷ 1,314,048 = 15.1%. The base has to be the same quantity as the numerator, and the numerator here is liquid assets alone. The loans made row and the borrowings row are not needed.
Question 3 of 12
Assets (financial year end)
| A | B | C | D | E | |
|---|---|---|---|---|---|
| Liquid assets | 198,050 | 145,050 | 178,500 | 158,425 | 195,999 |
| Loans made | 85,425 | 98,050 | 51,050 | 99,050 | 62,500 |
| Derivatives | 65,345 | 98,485 | 92,465 | 89,100 | 88,740 |
| Fixed assets | 75,050 | 92,050 | 71,500 | 108,425 | 90,999 |
| Total | 423,870 | 433,635 | 393,515 | 455,000 | 438,238 |
Liabilities (financial year end)
| A | B | C | D | E | |
|---|---|---|---|---|---|
| Reserve liabilities | 78,425 | 89,050 | 95,425 | 88,999 | 71,430 |
| Borrowings | 98,050 | 95,500 | 85,050 | 98,425 | 98,500 |
| Share liabilities | 65,425 | 60,425 | 70,430 | 76,335 | 90,999 |
| Other liabilities | 181,500 | 155,999 | 179,425 | 151,425 | 192,500 |
| Total | 423,400 | 400,974 | 430,330 | 415,184 | 453,429 |
The tables show the assets and the liabilities of five competitor firms at the financial year end, in pounds. Taking the five firms together, what is the mean value of liquid assets and fixed assets held per firm?
Answer: A. £262,810
Total the liquid assets row: 198,050 + 145,050 + 178,500 + 158,425 + 195,999 = 876,024. Total the fixed assets row: 75,050 + 92,050 + 71,500 + 108,425 + 90,999 = 438,024. Combined holding = 876,024 + 438,024 = 1,314,048. Mean per firm = 1,314,048 ÷ 5 = £262,809.60, so £262,810 to the nearest pound. The most tempting wrong method is to round each of the ten figures to the nearest 10,000 before adding, which gives £266,000. Rounding taken before the division carries its error into every term and the sum drifts by more than £3,000. Round at the end, not at the start. The derivatives, loans made and liabilities rows are not needed.
Question 4 of 12
| Units Sold | KV Stores | Esdel | Testroe | Raiday | Waingoods |
|---|---|---|---|---|---|
| Frozen goods | 72,450 | 79,138 | 98,950 | 97,325 | 89,175 |
| Tinned goods | 170,350 | 98,900 | 85,275 | 62,350 | 50,900 |
| Packet goods | 49,168 | 44,475 | 32,598 | 44,295 | 46,158 |
| Non-foods | 91,900 | 108,275 | 74,900 | 90,849 | 71,350 |
| Total | 383,868 | 330,788 | 291,723 | 294,819 | 257,583 |
| Units Stored | KV Stores | Esdel | Testroe | Raiday | Waingoods |
|---|---|---|---|---|---|
| Frozen goods | 22,263 | 22,250 | 19,609 | 17,858 | 23,856 |
| Tinned goods | 47,750 | 49,213 | 49,025 | 49,250 | 42,525 |
| Packet goods | 15,106 | 19,084 | 16,356 | 22,750 | 17,609 |
| Non-foods | 39,000 | 37,856 | 45,375 | 48,125 | 44,856 |
| Total | 124,119 | 128,403 | 130,365 | 137,983 | 128,846 |
The tables show units sold and units stored across five grocery chains. How many units in total did Waingoods sell across frozen goods and tinned goods?
Answer: C. 140,075 units
Work in the units sold table and in the Waingoods column only. Frozen goods sold = 89,175. Tinned goods sold = 50,900. Total = 89,175 + 50,900 = 140,075 units. The most tempting wrong method is to take the same two rows from the units stored table, 23,856 + 42,525 = 66,381. Stock held is not stock sold, and the two tables sit one above the other with identical row labels. Nothing in the units stored table is needed here.
Question 5 of 12
| Units Sold | KV Stores | Esdel | Testroe | Raiday | Waingoods |
|---|---|---|---|---|---|
| Frozen goods | 72,450 | 79,138 | 98,950 | 97,325 | 89,175 |
| Tinned goods | 170,350 | 98,900 | 85,275 | 62,350 | 50,900 |
| Packet goods | 49,168 | 44,475 | 32,598 | 44,295 | 46,158 |
| Non-foods | 91,900 | 108,275 | 74,900 | 90,849 | 71,350 |
| Total | 383,868 | 330,788 | 291,723 | 294,819 | 257,583 |
| Units Stored | KV Stores | Esdel | Testroe | Raiday | Waingoods |
|---|---|---|---|---|---|
| Frozen goods | 22,263 | 22,250 | 19,609 | 17,858 | 23,856 |
| Tinned goods | 47,750 | 49,213 | 49,025 | 49,250 | 42,525 |
| Packet goods | 15,106 | 19,084 | 16,356 | 22,750 | 17,609 |
| Non-foods | 39,000 | 37,856 | 45,375 | 48,125 | 44,856 |
| Total | 124,119 | 128,403 | 130,365 | 137,983 | 128,846 |
The tables show units sold and units stored across five grocery chains. Across all four categories combined, Testroe’s units stored are what percentage of its units sold?
Answer: A. 44.7%
Testroe’s units stored total 130,365 and its units sold total 291,723. Stored as a share of sold = 130,365 ÷ 291,723 = 0.44688, so 44.7%. The most tempting wrong method is to work out the stored to sold ratio for each of the four categories and average the four, which gives 47.0%. That treats packet goods, where 32,598 units were sold, as counting for as much as tinned goods, where 85,275 were. A combined ratio has to be built from the totals, not from the mean of the category ratios.
Question 6 of 12
| Units Sold | KV Stores | Esdel | Testroe | Raiday | Waingoods |
|---|---|---|---|---|---|
| Frozen goods | 72,450 | 79,138 | 98,950 | 97,325 | 89,175 |
| Tinned goods | 170,350 | 98,900 | 85,275 | 62,350 | 50,900 |
| Packet goods | 49,168 | 44,475 | 32,598 | 44,295 | 46,158 |
| Non-foods | 91,900 | 108,275 | 74,900 | 90,849 | 71,350 |
| Total | 383,868 | 330,788 | 291,723 | 294,819 | 257,583 |
| Units Stored | KV Stores | Esdel | Testroe | Raiday | Waingoods |
|---|---|---|---|---|---|
| Frozen goods | 22,263 | 22,250 | 19,609 | 17,858 | 23,856 |
| Tinned goods | 47,750 | 49,213 | 49,025 | 49,250 | 42,525 |
| Packet goods | 15,106 | 19,084 | 16,356 | 22,750 | 17,609 |
| Non-foods | 39,000 | 37,856 | 45,375 | 48,125 | 44,856 |
| Total | 124,119 | 128,403 | 130,365 | 137,983 | 128,846 |
The tables show units sold and units stored across five grocery chains. Taking the five chains together, what is the mean number of units sold per chain across frozen goods and tinned goods combined?
Answer: D. 180,963 units
Total the frozen goods row of the units sold table: 72,450 + 79,138 + 98,950 + 97,325 + 89,175 = 437,038. Total the tinned goods row: 170,350 + 98,900 + 85,275 + 62,350 + 50,900 = 467,775. Combined = 437,038 + 467,775 = 904,813. Mean per chain = 904,813 ÷ 5 = 180,962.6, so 180,963 units. The most tempting wrong method is to divide by 10 because ten figures were added, giving 90,481. The question asks for a figure per chain and there are five chains, so the divisor is 5 whatever the number of cells read. The units stored table is not needed.
Question 7 of 12
| Yesterday’s price | Today’s price | Highest price (last month) | Lowest price (last month) | Highest price (this year) | Lowest price (this year) | |
|---|---|---|---|---|---|---|
| Duber | 1.34 | 1.31 | 1.36 | 0.96 | 1.41 | 0.95 |
| Sebs | 1.64 | 1.56 | 1.68 | 1.42 | 1.81 | 1.37 |
| GEV | 1.58 | 1.64 | 1.85 | 1.42 | 1.99 | 1.31 |
| Faldum | 2.37 | 2.51 | 3.13 | 2.63 | 3.26 | 2.31 |
| AKUM | 2.37 | 2.32 | 2.46 | 2.32 | 2.59 | 2.26 |
The table shows share prices in pounds for five listed companies. What is the combined cost of buying one share in each of the five companies at today’s prices?
Answer: D. £9.34
Take the today’s price column only, and read all five rows: Duber 1.31, Sebs 1.56, GEV 1.64, Faldum 2.51, AKUM 2.32. Total = 1.31 + 1.56 + 1.64 + 2.51 + 2.32 = £9.34. The most tempting wrong method is to total the neighbouring column instead, giving £9.30. Yesterday’s and today’s prices sit side by side and differ by only a few pence in most rows, so the wrong column produces a total close enough to look right. The four monthly and yearly high and low columns are not needed.
Question 8 of 12
| Yesterday’s price | Today’s price | Highest price (last month) | Lowest price (last month) | Highest price (this year) | Lowest price (this year) | |
|---|---|---|---|---|---|---|
| Duber | 1.34 | 1.31 | 1.36 | 0.96 | 1.41 | 0.95 |
| Sebs | 1.64 | 1.56 | 1.68 | 1.42 | 1.81 | 1.37 |
| GEV | 1.58 | 1.64 | 1.85 | 1.42 | 1.99 | 1.31 |
| Faldum | 2.37 | 2.51 | 3.13 | 2.63 | 3.26 | 2.31 |
| AKUM | 2.37 | 2.32 | 2.46 | 2.32 | 2.59 | 2.26 |
The table shows share prices in pounds for five listed companies. By what percentage is Sebs’s price today below its highest price this year?
Answer: B. 13.8%
Sebs’s highest price this year is 1.81 and its price today is 1.56. The fall is 1.81 − 1.56 = 0.25. As a percentage of the price it fell from: 0.25 ÷ 1.81 = 0.13812, so 13.8%. The most tempting wrong method is to divide the fall by today’s price, giving 16.0%. A percentage fall is always measured against the starting value, so the denominator is the year’s high. The last month columns and the year’s low are not needed.
Question 9 of 12
| Yesterday’s price | Today’s price | Highest price (last month) | Lowest price (last month) | Highest price (this year) | Lowest price (this year) | |
|---|---|---|---|---|---|---|
| Duber | 1.34 | 1.31 | 1.36 | 0.96 | 1.41 | 0.95 |
| Sebs | 1.64 | 1.56 | 1.68 | 1.42 | 1.81 | 1.37 |
| GEV | 1.58 | 1.64 | 1.85 | 1.42 | 1.99 | 1.31 |
| Faldum | 2.37 | 2.51 | 3.13 | 2.63 | 3.26 | 2.31 |
| AKUM | 2.37 | 2.32 | 2.46 | 2.32 | 2.59 | 2.26 |
The table shows share prices in pounds for five listed companies. If GEV’s price were to fall from today’s price by the same percentage as Duber’s price fell between yesterday and today, what would GEV’s price become?
Answer: C. £1.60
First work out Duber’s percentage fall. Duber went from 1.34 yesterday to 1.31 today, a fall of 0.03. 0.03 ÷ 1.34 = 0.022388, so a fall of 2.2388%. Now apply that same percentage to GEV’s price today, which is 1.64: 1.64 × (1 − 0.022388) = 1.64 × 0.977612 = 1.60328, so £1.60. The most tempting wrong method is to read Duber’s fall of 3p as a fall of 3%, which gives 1.64 × 0.97 = £1.59. A fall in pence and a fall as a percentage are different quantities, and the options are a penny apart. Carry the unrounded rate through and round only the final price. GEV’s own price yesterday is not needed, and neither are the high and low columns.
Question 10 of 12
| 2018 | 2019 | 2020 | 2021 | 2022 | |
|---|---|---|---|---|---|
| Sales (Bikes & Accessories) | £103.8m | £106.1m | £104.5m | £106.2m | £101.3m |
| Bikes Sold | 13,360 | 13,165 | 14,900 | 13,630 | 16,100 |
| Price per Bike | £6,430 | £7,160 | £5,820 | £6,040 | £5,999 |
| Production Cost per Bike | £3,740 | £4,106 | £3,608 | £4,125 | £4,010 |
| Other Costs per Bike | £1,213 | £1,746 | £1,018 | £489 | £825 |
The table shows five years of figures for a bicycle manufacturer. In 2022, the price of a bike was how many times the combined production cost and other costs per bike?
Answer: A. 1.24 times
Read the 2022 column. Production cost per bike = £4,010 and other costs per bike = £825. Combined cost per bike = 4,010 + 825 = £4,835. Price per bike = £5,999. 5,999 ÷ 4,835 = 1.2407, so 1.24 times. The most tempting wrong method is to divide by the production cost alone, giving 1.50 times. The question names both cost lines, and the other costs row is the one a reader skips because it is the smaller of the two. The sales line and the bikes sold row are not needed.
Question 11 of 12
| 2018 | 2019 | 2020 | 2021 | 2022 | |
|---|---|---|---|---|---|
| Sales (Bikes & Accessories) | £103.8m | £106.1m | £104.5m | £106.2m | £101.3m |
| Bikes Sold | 13,360 | 13,165 | 14,900 | 13,630 | 16,100 |
| Price per Bike | £6,430 | £7,160 | £5,820 | £6,040 | £5,999 |
| Production Cost per Bike | £3,740 | £4,106 | £3,608 | £4,125 | £4,010 |
| Other Costs per Bike | £1,213 | £1,746 | £1,018 | £489 | £825 |
The table shows five years of figures for a bicycle manufacturer. Revenue from bikes alone is the number of bikes sold multiplied by the price per bike. By what percentage did revenue from bikes alone change between 2018 and 2022?
Answer: C. 12.4%
2018 revenue from bikes = 13,360 × £6,430 = £85,904,800. 2022 revenue from bikes = 16,100 × £5,999 = £96,583,900. Change = 96,583,900 − 85,904,800 = £10,679,100, a rise. As a percentage of the 2018 figure: 10,679,100 ÷ 85,904,800 = 0.12431, so a rise of 12.4%. The most tempting wrong method is to add the two underlying percentage changes, the 20.5% rise in bikes sold and the 6.7% fall in price, for 13.8%. Percentage changes on two factors of a product compound rather than add: 1.205 × 0.933 = 1.124, which is the 12.4% above. The sales line covers accessories as well as bikes, so it does not give revenue from bikes.
Question 12 of 12
| 2018 | 2019 | 2020 | 2021 | 2022 | |
|---|---|---|---|---|---|
| Sales (Bikes & Accessories) | £103.8m | £106.1m | £104.5m | £106.2m | £101.3m |
| Bikes Sold | 13,360 | 13,165 | 14,900 | 13,630 | 16,100 |
| Price per Bike | £6,430 | £7,160 | £5,820 | £6,040 | £5,999 |
| Production Cost per Bike | £3,740 | £4,106 | £3,608 | £4,125 | £4,010 |
| Other Costs per Bike | £1,213 | £1,746 | £1,018 | £489 | £825 |
The table shows five years of figures for a bicycle manufacturer. The sales line covers bikes and accessories together. In 2020, what percentage of sales came from accessories?
Answer: B. 17.0%
Work out 2020 revenue from bikes: 14,900 × £5,820 = £86,718,000, or £86.718m. Total sales in 2020 were £104.5m, and that line covers accessories as well. Accessories revenue = 104.5 − 86.718 = £17.782m. As a percentage of sales: 17.782 ÷ 104.5 = 0.17016, so 17.0%. The most tempting wrong method is to divide the accessories revenue by the bike revenue instead, giving 20.5%. The question asks for a share of sales, so the base is the whole sales line, not the part of it the accessories figure was derived from. The cost rows are not needed.






A Korn Ferry assessment is an online test from the global consulting firm's assessment range, much of it built on the Talent Q products Korn Ferry acquired. The Elements ability tests, covering verbal, numerical and logical reasoning, are adaptive and give you a separate time allowance for each question. Aspects handles high volume screening, and untimed questionnaires such as the KF4D profile personality and leadership traits.
Which Korn Ferry test you sit depends on the employer and the role: an entry-level position will not be given the same assessment as a graduate or managerial one.
Four things to know before you sit one. Timings and difficulty vary with the level of the role.
Match the name in your invitation to the assessment below. Timings marked “approx.” are completion estimates; other published durations are limits for the named version.
| Assessment | What it measures | Questions | Timing |
|---|---|---|---|
| Elements Verbal | Understanding and interpreting written, business-related information; adaptive | 15 | 16 min |
| Elements Numerical | Analysing statistical data in tables and charts; adaptive | 12 | 16 min |
| Elements Logical | Seeing patterns and themes in shapes and symbols; adaptive | 12 | 15 min |
| Aspects Ability | Comparing information quickly and accurately, with verbal and numerical screening for volume roles | Varies by test | Verbal 8; numerical 10; checking 6 min |
| Assessment of Leadership Potential (KFALP) | Leadership potential, including drivers, experience, awareness and learning agility | See invitation | See invitation |
| Four-Dimensional Assessment (KF4D) | Competencies, experiences, traits and drivers | Mixed | See invitation |
| viaEdge | Learning agility across mental, people, change, results and self-awareness | Questionnaire | See invitation |
Counts and timings vary by role level and by the version an employer licences. Check the instructions on the screen before you start. Facts checked 11 September 2026.
Talent Q assessments are delivered by Korn Ferry. Elements questions are individually timed; the figures below are the published overall allowances. Questionnaire durations are estimates, not time limits.
A visual guide to the skills and response formats covered on this page. Your invitation tells you which assessments to prepare for.
Illustrations by Practice Aptitude Tests · not official test screenshots
What is the percentage increase?
Interpret tables and charts. Each question has its own time allowance.
View guidanceFind the missing shape
Find the difference
The last two digits have swapped.
Compare details quickly and accurately in a separately timed test.
View guidanceIf you know which company invited you, start there: the employer guide tells you which Korn Ferry assessment sits at which stage of that firm's process.
Not listed? Browse all employer guides.
The free test shows you the style. A pack gives you the pace: Individually timed a question, marked, with the working shown.
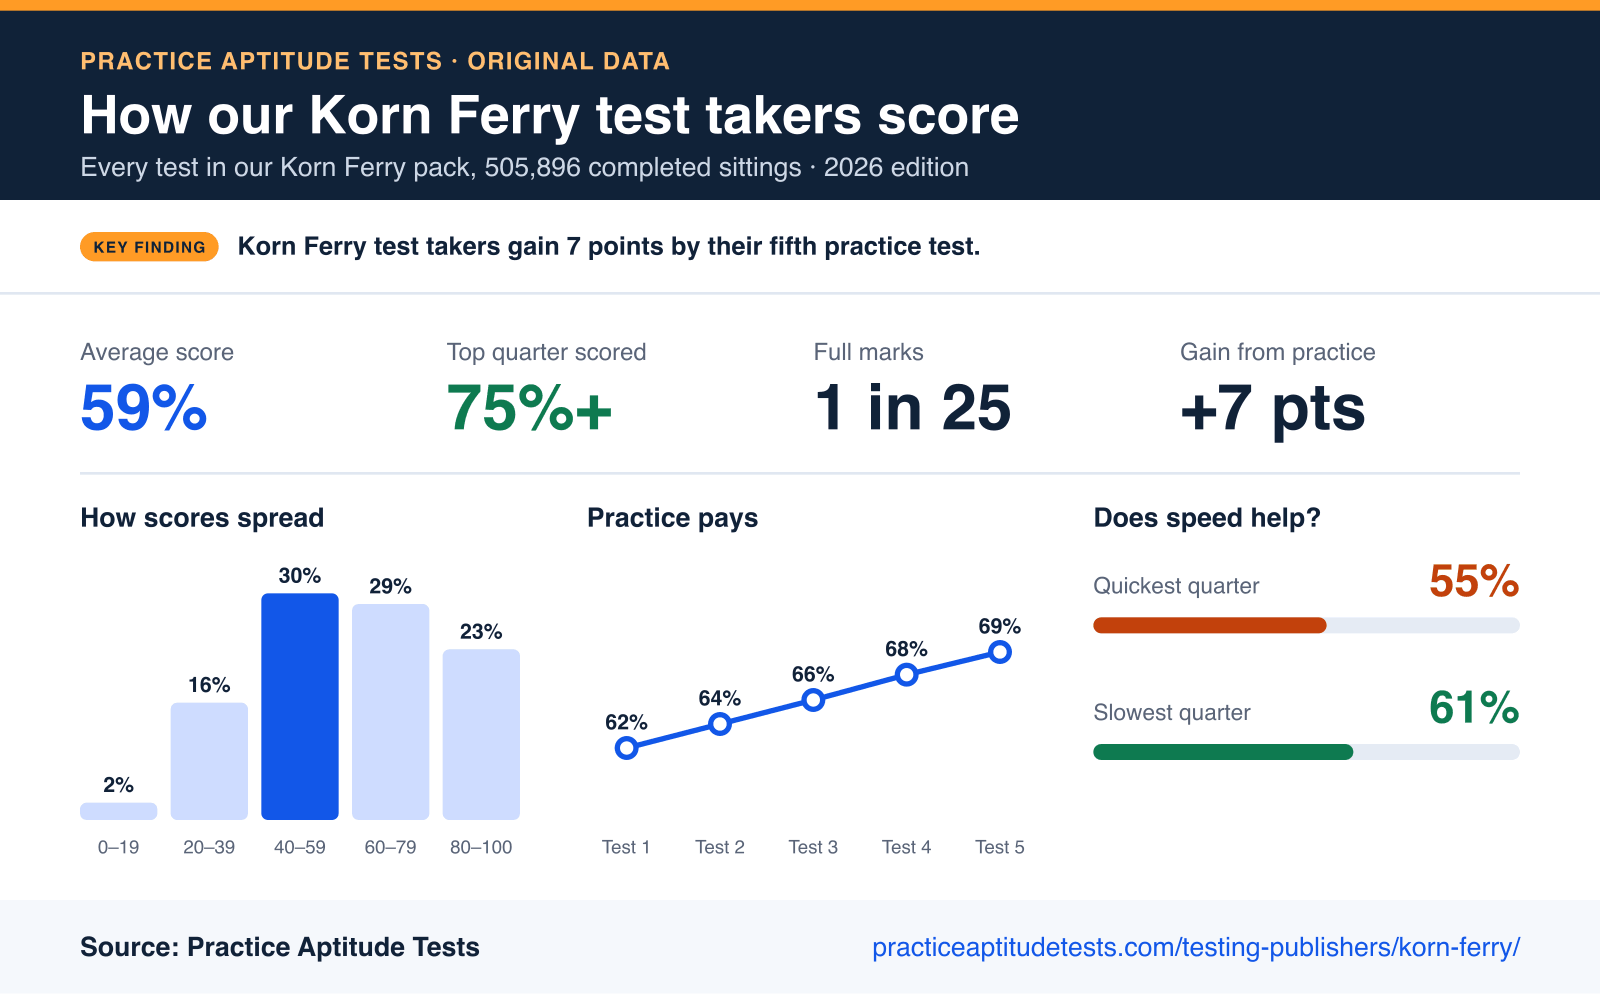
Practice Aptitude Tests · Original data
Results from every test in our Korn Ferry pack, past and present.
Key findingKorn Ferry test takers gain 7 points by their fifth practice test.
23% scored 80% or more, and 18% scored under 40%.
Share of sittings in each score band.
Regular practisers went from 62% on their first test to 69% on their fifth.
8,393 people who took five or more tests.
Rushing costs marks. The quickest quarter scored 6 points lower than the slowest.
Typical pace: 37 seconds a question.
Korn Ferry is a trademark of its respective owner. Practice Aptitude Tests is not affiliated with Korn Ferry and our practice tests are not endorsed by them.