
Updated
What is a data interpretation question?
Many jobs require employees to be able to interpret, analyse and make strategic decisions based on data, which is commonly presented in charts, graphs and tables.
Data interpretation questions, which often feature in numerical reasoning tests, assess someone’s ability to interpret mathematical data.
By using workplace-based examples appropriate to the role and level at which the candidate is applying, data interpretation tests allow recruiters and employers to understand whether they have the requisite skills. Test scores may also be ranked by how quickly candidates were able to ascertain the correct answers.
Where might you face data interpretation questions?
You might expect such questions in numerical reasoning tests when applying for graduate or management level roles, especially if you are applying to jobs in the corporate, financial or consulting sectors.
That said, date interpretation is a widely used and required skill across pretty much all industries, so it is best to be prepared.
You may also expect to face a data interpretation test if the role you apply for includes any data analysis or strategic decision making, or data handling. This could include marketing, clerical and administrative roles, as well as managerial positions where you will have decision-making responsibilities.
Tips on how to answer data interpretation questions
1) You don’t need a maths degree
The first thing to remember is that you don’t have to have studied mathematics at an advanced level to do well in data interpretation questions. The skill lies in interpreting the data, extrapolating that into a mathematical solution and then potentially using that answer to make a decision.
2) Review the data first
Start with the data and scan the information. What is the title? What are the axes or keys showing? Mentally note whether things are numbers, years or other types of data - but equally, don’t spend too long considering information which may be irrelevant.
3) Answer the question asked
Then move onto reading the question in full, so that you know which specific data is required (e.g. March and April, not any other months). It’s not like school where importance is given to how you worked it out. For the numerical reasoning test, a wrong answer is a wrong answer.
4) Remember it is multiple choice
You might not need to work out precisely the right answer to ascertain which the correct option is from the multiple-choice options. For example, in the example below, as soon as you have divided the total into 3, you can see from the multiple choice options that there is only one option or choice that is in the four thousands, so you don’t need to go on to multiply the number. Select the answer and move on.
Example data interpretation practice question 1
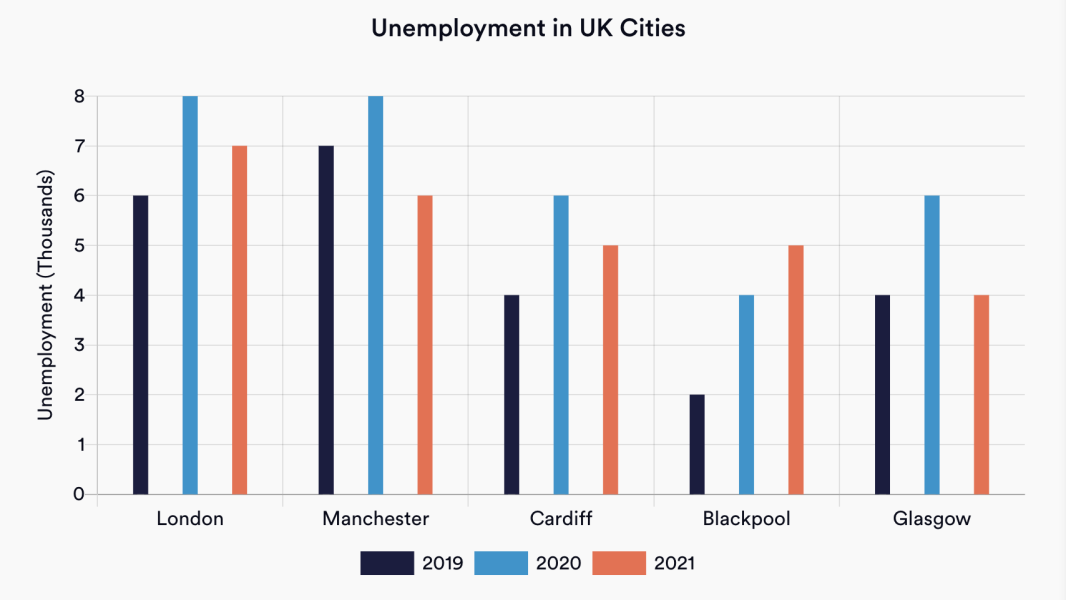
What was the average number of unemployed people in London, Cardiff and Glasgow in 2019?
To answer this question you need to work out the average number of unemployed people in 2019 in three specified cities: London, Cardiff and Glasgow.
- 1) Note down the figures for these cities in 2019. By consulting the key at the bottom of the graph you will see you only need the dark blue figures, and only the correct columns by city. So 6K (London), 4K (Cardiff) and 4K (Glasgow).
- 2) Add these figures together (6K + 4K + 4K) = 14K
- 3) Now you need to find the average. Divide your total (14K) by 3 (as there are three cities) to calculate the average to the nearest thousand = 4.667, showing you the answer to select is 4,667.
Example data interpretation practice question 2
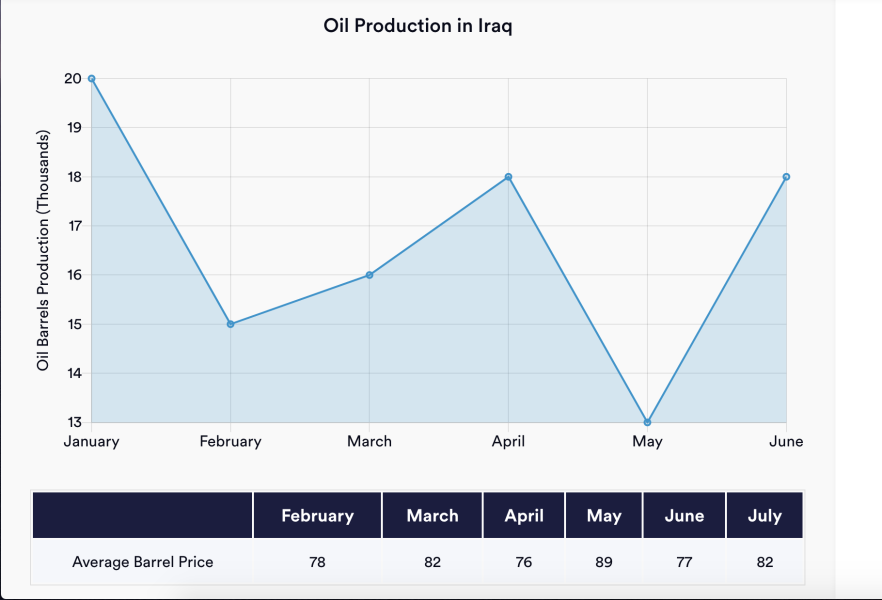
What was the percentage change in the value of oil produced from April to May?
This question looks at oil production in Iraq set out using a graph measuring months from January to June. It also shows the number of oil barrels produced and the average barrel price.
You are asked to calculate the percentage change in the value of the oil produced from April to May.
- 1) Note that you will need to look at only two months of data, namely April and May.
- 2) Identity the production amount for April, which is 18,000 barrels.
- 3) Identity the production amount for May, which is 13,000 barrels.
- 4) Calculate the value of oil produced for April using the chart at the bottom of the table (18,000 barrels x $76 average barrel price, which equals $1,368,000)
- 5) Calculate the value of oil produced for May in the same way (13,000 barrels x $89 average barrel price, which equals $1,157,000)
- 6) Work out the difference in value ($1,368,000 - $1,157,000 which gives you a difference of $211,000).
- 7) Use these sums to work out the percentage decrease (amount of decrease divided by original amount x 100 to give a percentage) so $211,000 divided by $1,368,000 multiplied by 100 gives you -15.42%.
How to prepare for data interpretation questions
Revise and practice your skills
Revise your basic mathematical skills such as averages, percentages, fractions etc, until you can recognise them easily and calculate them without having to look up formulae.
Get faster
Remember that you need to be able to answer these questions quickly, as even if the specific numerical reasoning test you take doesn’t have a time limit, recruiters will usually be looking at how quickly you were able to get a full set of answers right.
To be fully prepared, read our complete guide to Numerical Reasoning.